Custom Business Dashboard vs Power BI and Looker Studio: How to Choose
Custom business dashboard, Power BI or Looker Studio? A practical guide to what each costs, when building your own pays off and what a first version should include.

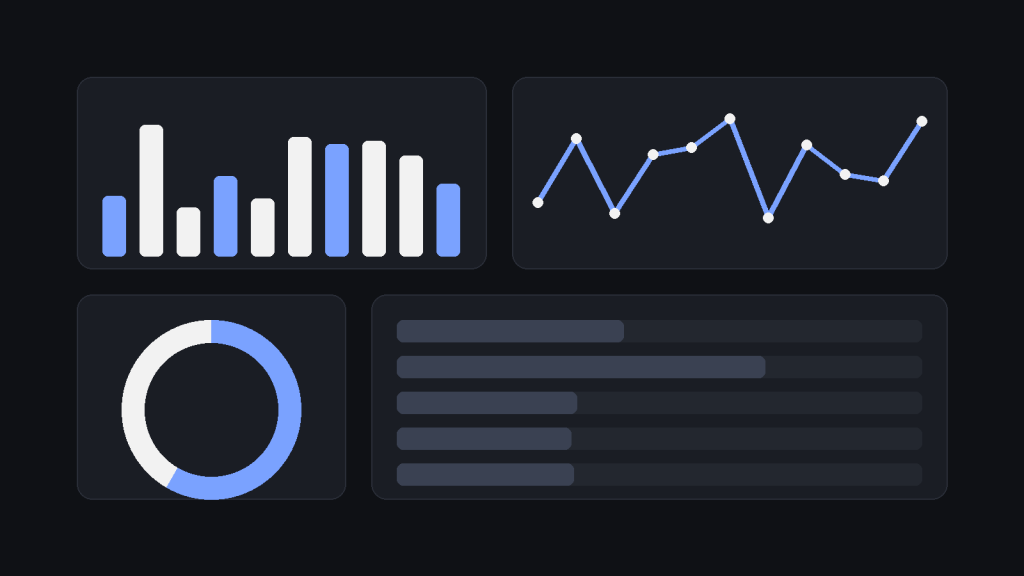
Every growing business reaches the same point: the numbers that matter live in five places (accounting software, a CRM, a spreadsheet, the online store, someone’s inbox), and every Monday somebody spends half a day stitching them into a report. At that moment the question becomes: do we buy a tool like Power BI or Looker Studio, or do we build a custom business dashboard?
Both answers can be right. This guide explains how to decide, what each route really costs you (in money and in effort), and what a first version of a custom dashboard should contain, so you don’t pay for software when a free tool would do, or fight a tool that was never going to fit.
What a business dashboard should actually do
A dashboard is not a collection of charts. It is a screen that lets a specific person answer a specific question quickly, and decide what to do next. “How many orders are late today?” is a dashboard question. “Show everything about sales” is not.
Before comparing tools, write down three things:
- Who will look at it (owner, sales team, warehouse, a client) and how often.
- Which 5–8 numbers drive their decisions. More than that and nobody reads it.
- Where each number comes from, and whether that source can be read automatically (database, API, export) or only by copying from a screen.
That third point decides most projects. A beautiful dashboard on top of data that has to be pasted in by hand will be abandoned within a month.
Your three realistic options
1. Looker Studio: the free starting point
Looker Studio is Google’s free reporting tool. It connects easily to Google products (Analytics, Ads, Sheets, BigQuery) and to many other sources through connectors. It is excellent for marketing reports and simple KPI pages, and it is shareable by link. Its limits show up when you need heavy data modelling, row-level permissions, or reports built on several messy sources at once; also, some third-party connectors are paid.
2. Power BI: the analyst’s workbench
Power BI is Microsoft’s business intelligence platform. It handles larger datasets, proper data models and complex calculations, and fits naturally if you already live in Microsoft 365 or Azure. It pays off when you have someone who can maintain the data model, and when licences per viewer stay manageable. Check the current licence terms on Microsoft’s pricing page before planning, because they change and depend on how many people need to view reports.
3. A custom dashboard: software built around your process
A custom dashboard is a small web application, with your login, your data and your layout. It reads from your databases and systems directly, can write back (approve an order, assign a task, mark an invoice), and can be embedded in a customer portal or sold as part of a product. You get exactly the behaviour you need; in exchange you take on development and maintenance.
Custom dashboard vs Power BI vs Looker Studio
| Looker Studio | Power BI | Custom dashboard | |
|---|---|---|---|
| Best for | Marketing and simple KPI reports | Analysis across many sources, internal reporting | Operational screens, client-facing data, embedded analytics |
| Time to first version | Hours to days | Days to weeks | Weeks |
| Can users take action inside it? | No, view only | Limited | Yes: forms, approvals, workflows |
| Permissions per user or client | Basic | Good, with setup | Whatever your rules require |
| Cost pattern | Free to start; connectors may cost | Per-user licences | One-off build plus maintenance |
| Main risk | Slow and hard to govern as it grows | Depends on a skilled report author | Over-building before the need is proven |
When a custom business dashboard is the right call
In our experience these are the situations where a ready-made tool stops being the cheaper option:
- The dashboard is part of what you sell. If clients log in to see their own orders, usage or reports, you need your own branding, access rules and a smooth experience. That usually means a customer portal, not a shared BI link.
- People need to act, not just look. A warehouse screen where staff confirm picking, or a sales view where a manager approves discounts, is an application, not a report.
- Your data lives in systems BI tools don’t connect to well: an older in-house database, a local fiscal or ERP system, WhatsApp or custom forms. Building a proper API and systems integration once beats re-exporting files forever.
- Per-viewer licensing would grow with your team or customers. A flat custom build can be cheaper than licences multiplied across dozens of users.
- Privacy or compliance rules limit where data may go. A dashboard on your own infrastructure keeps sensitive records inside your control.
- You want it connected to your CRM or operations tool. A dashboard that sits on top of a custom CRM or internal system can share its database directly, with no sync to maintain.
When you should not build one
A custom build is the wrong choice when:
- Your questions are standard (website traffic, ad spend, basic sales totals) and Looker Studio can answer them this week for free.
- You don’t yet know which numbers matter. Start with a spreadsheet or a free tool, and let usage show you what is worth building.
- Nobody will own it. Every new metric, filter or source needs someone responsible. If that person doesn’t exist, a simpler tool is safer.
A sensible path for many companies is staged: start in Looker Studio or Power BI, prove which views people use every day, then rebuild only those few as a custom application. This is the same discipline we describe in our MVP development guide: spend on what has earned it.
What a first custom dashboard should contain
- One audience, one job. For example “daily operations view for the sales manager”, not “company dashboard”.
- 5–8 core metrics with clear definitions written down (what counts as a “closed order”? Gross or net?). Disagreement over definitions is the number one reason people distrust dashboards.
- Automatic data refresh from the source system, with a visible “last updated” time.
- Filters people really use: date range, branch, salesperson, product category. Skip the rest.
- Drill-down to the record. Clicking a number should take you to the orders or invoices behind it.
- Roles and permissions designed up front, so each person sees only what they should.
- Alerts by email or WhatsApp when something crosses a threshold, so people don’t have to remember to check.
- Export to CSV or PDF, because someone will always ask for it.
Later phases can add forecasting, comparisons, write-back actions and AI features such as plain-language questions over the data. Those are easier to add to an existing system than you might expect; see how to add AI to existing software without rebuilding it.
What does a custom dashboard cost?
There is no single honest number, because scope varies widely. A single-audience dashboard reading from one clean database is a small project; one that merges five systems, supports client logins and writes back to an ERP is a much larger one. The main cost drivers are:
- the number and quality of data sources (a source with a good API is cheap; one with none is not);
- how many user roles and permission rules exist;
- whether users can take actions or only view;
- how much data there is and how fresh it must be (real time vs daily);
- design polish and branding, especially for client-facing use.
Ongoing costs matter as much as the build: hosting, security updates, and the steady trickle of new metrics and filters. Budget for them from day one, and see our broader breakdown in custom software development cost. The cheapest way to control spend is to fix a small first phase, agree a price for it, and treat everything else as optional.
Frequently asked questions
Is a custom dashboard better than Power BI?
Neither is better in general. Power BI is stronger for analysts exploring many sources; a custom dashboard is stronger when users must act inside it, when clients need access, or when your data and permissions don’t fit a standard tool.
Can I start with Looker Studio and move to custom later?
Yes, and it is often the smartest route. The definitions, metrics and layouts you refine in a free tool become the specification for a custom build, which lowers risk and cost.
How long does it take to build a custom dashboard?
A focused first version, one audience and a handful of metrics from one or two sources, typically takes weeks rather than months. Integrations with older systems and complex permissions are what extend the timeline.
Can a dashboard use data from Excel and our accounting software together?
Usually, yes. The first step is replacing manual spreadsheet copying with an automatic import or API connection, so the dashboard is always current. If your reports still depend on Excel, this is often the best first project.
Will it work on phones?
A custom dashboard built as a responsive web application works in any browser on desktop and mobile, with no app store required.
Talk to us about your dashboard
If your team still builds reports by hand, or clients keep asking for a way to see their own data, we can help you decide whether a ready-made tool is enough or a custom dashboard is worth building. Tell us who needs the numbers, which systems hold them and what decision they should support. We’ll come back with a recommended first phase, the risks we see and a transparent estimate.
Request a consultation with Shkulaku or explore our software development services.
I take on a small number of projects at a time. Tell me what you are building and I will tell you honestly whether I am the right person for it.
Get in touch →Keep reading
Dobësi në kernelin Linux: Fragnesia dhe defekti TCP që duhet përditësuar tani
Dy dobësi në kernelin Linux po bëjnë lajme këtë javë: Fragnesia (CVE-2026-46300), tashmë në listën e CISA për dobësi të shfrytëzuara, dhe një defekt i ri TCP (CVE-2026-98432). Ja çfarë do të thotë secila për biznesin tuaj dhe një listë praktike përditësimi.
Linux Kernel Vulnerability Alert: Fragnesia and the TCP Flaw Server Owners Should Patch Now
Two Linux kernel flaws are in the news this week: Fragnesia (CVE-2026-46300), now on CISA's known-exploited list, and a new TCP bug (CVE-2026-98432). Here is what each one means for a business running Linux servers, and a practical patch checklist.
Njoftim sigurie nga PHP për session upload progress (CVE-2026-115560): mbajeni të çaktivizuar
Ekipi i sigurisë së PHP rekomandon session.upload_progress.enabled=0 deri në versionin e radhës, për të mbyllur një rrugë të pagjasë RCE (CVE-2026-115560). Ja kush preket realisht dhe si ta kontrolloni për dy minuta.